2021 Real Estate Recap
The 2021 yearly Real Estate Recap compares Fort Saskatchewan, Sherwood Park and Edmonton.
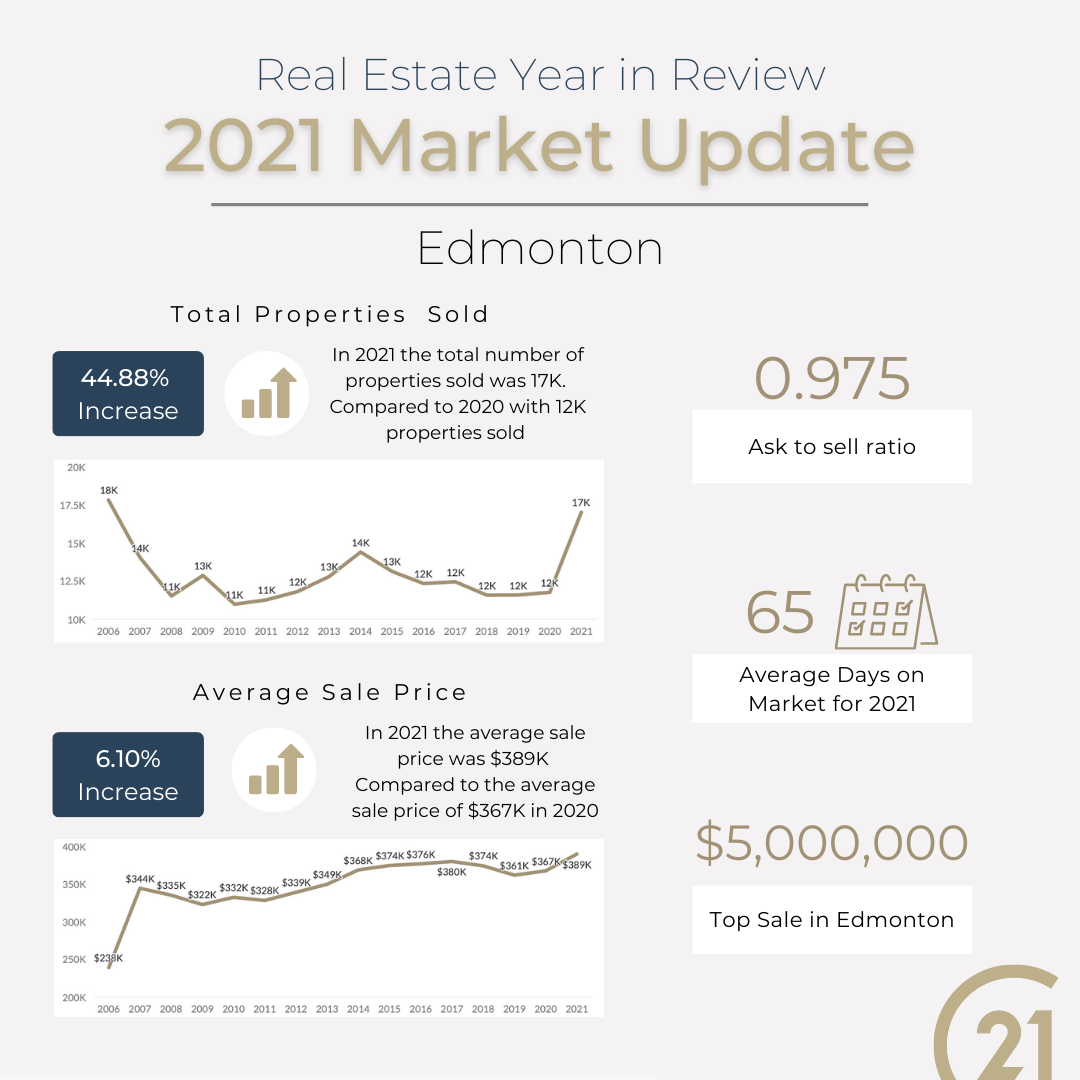
For 2020, the total volume of sales was $4.31B in Edmonton. Additionally, the total volume of sales was $6.62B for 2021. Compared to the year 2020, the total volume of sales has increased by 53.72%.
Edmonton saw an average of 91 days on the market for 2020. Comparatively 2021, the average number of days on market was 64.


In Sherwood Park, the average number of days on market was 65 for 2020. In the year 2021, the average number of days on market was 40.
With 2020 we saw the total volume of sales was $451M for Sherwood Park. As seen in 2021, the total volume of sales was $638M. Likewise, when 2021 relates to 2020, the total volume of sales has increased by 41.48%.
Finally 2020, the total volume of sales was $187M. In the year 2021, the total volume of sales was $296M. When the year 2021 is compared to the year 2020, the total volume of sales has increased by 58.44%.
Fort Saskatchewan saw an average of 59 days on market. In the year 2020, the average number of days on market was 79.

What's in the Report?
Total Listings:
The total amount of properties for which the seller has entered into a written service agreement with a real estate brokerage to market his or her property for sale. These are all the real estate that has come up for sale on the market. (This does not mean all the homes sold, some would have been terminated, expired or withdrawn)
Average List Price:
The amount of money that a property is under contract with a brokerage. This is the average of all the properties. This price is advertised to the public and marketed through various listing databases by the brokerage. Does not always sell for this price.
Total Inventory Cost:
The grand total of all the properties at their list price
Total Sales:
The total of all the sales for that region
Sales Average Price:
The sold price of the property. This is the average of the subject are.
Average LSR:
The average amount that sellers are receiving for their property. It is calculated by the amount property actually sold for compared to the amount the property was listed for.
